Stoll is the communications director for the House Appropriations Committee and he contacted me last week to express his displeasure with The Mercury's story analyzing the House of Representatives budget, and how it affected local districts, which first ran on our web site on June 13.
"Your story and the headline are incredibly misleading and
fails to accurately explain how school funding is distributed to school
districts," he wrote in a June 14 e-mail to me after the story appeared in print.
The print headline read "$28.3B House budget stiffs poorer school districts in Pa."
The story ran with this spread sheet I put together with information released every year by the House Appropriations Committee.
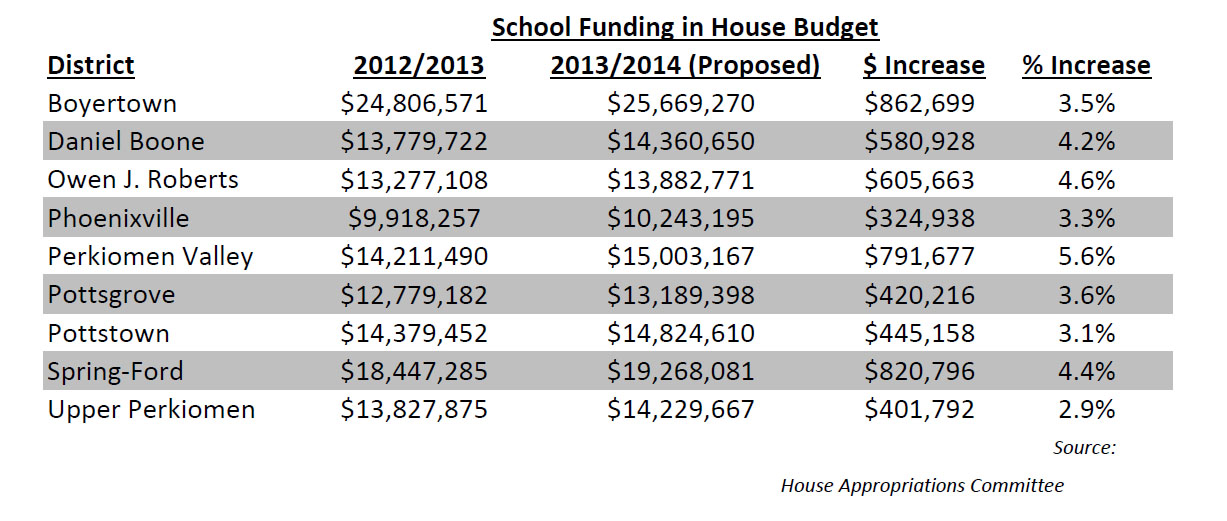
As you can see, the largest increase in total dollars, as well as the largest percentage increase, went to the Perkiomen Valley School District, not exactly a poor district, but also twice the student population of Pottstown or Pottsgrove.
The smallest increase, again by dollars and percentage, went to Upper Perkiomen, followed by Pottstown in a close second.
I have conducted this analysis over the past several years as a way to localize the state budget's impact on the school districts we cover.
But, quite understandably, Stoll has a different job and he has a Harrisburg perspective on these things.
I imagine he sees things from the standpoint of who gets the largest share of the state budget pie on a more state-wide scale.
We, on the other hand, look at things from the standpoint of how much does the budget provide to the school districts we cover? Which of those got the most/least? How does that compare to last year?
But Stoll raised an excellent point.
"As you see in the attachment, Pottstown gets the largest
per-student amount of any Montco school (Aside from Bryn-Athyn and their 7
students) and receives the largest percentage of their total funding from the
state," Stoll wrote in his e-mail to me.
This is the attachment that he is referring to:

The figures he is pointing to are the $4,647 per student figure and line that shows Pottstown gets 33.6 percent of its revenue from the state under the budget passed by the House.
Two other local districts, Upper Perkiomen at 33.3 percent and Pottsgrove at 26.7 percent, come in right behind Pottstown.
(We will ignore, for the sake of brevity, the fact that the state once funded 50 percent of most school budgets, because that will further complicate an already complicated discussion.)
The other districts, as the chart above shows, must raise much more of their revenue from local sources, which means mostly property taxes.
"As I am sure you know, school funding is driven out by a
funding formula that takes into account a district’s wealth and their ability
to raise money locally. This formula delivers a larger amount of state funds to
poorer school districts," Stoll wrote.
I had believed this to be true under Gov. Rendell, a change which came about as the result of the "costing out study," which looked at how much successful school districts spend per student, and trying to apportion state funding along the same lines.
The Pennsylvania School Funding Campaign, described it like this: the study "was to determine what it costs for all of our students -- no matter where they live -- to attain state academic standards. The study of equity was to address the growing gap between high- and low-spending districts."
To no one's surprise, the study, completed in December 2007, "concluded that Pennsylvania was under-funding K-12 education by more than $4 billion and that the system then in place relied too heavily on local property taxes."
The result of the change in formula was that Pottstown began getting a larger share of funding, funding which was applied largely to early education efforts and which bore fruit with higher test scores in the elementary grades, all of which made Adequate Yearly Progress in 2009.
However when Gov. Corbett took office, through no fault of his own he inherited a budget that had plugged a very large revenue hole drive by the financial crisis with about $700 million in federal stimulus funding, a gap that had to be closed.
No one envied him that task.
But his solution was a little ham-handed. He proposed to "level-fund" schools with the same amount of state money spent the year before.
This solution had the Harrisburg view, not the local view. Because locally, it was anything but "level."
As we reported in May, 2011, Corbett’s initial budget proposal, when analyzed by Good Schools Pennsylvania, "showed each Pottstown School District student will get $609 less in state funding under the plan. Each classroom in the district will lose more than $15,000 in state funding."
"At the other end of the spectrum, each Lower Merion student will lose only $83.81 — or $2,095 per classroom — under Corbett’s plan," we reported in 2011.
That may have been because, as Stoll has pointed out, Pottstown was getting more state funding per student to begin with, but it sure didn't seem like "level-funding" to local school officials scrambling to balance budgets.
Ultimately, the impact that year was less severe than Corbett had first proposed, but Pottstown and other districts still had to cut a number of teaching and administrative positions and toyed with shutting down music and art programs as a way to close its budget gap.


I had the impression that the 2011 budget did away with the funding formula that steered more money, proportionally, to lower-income districts.
But Stoll tells me that is not the case and I have no reason to doubt him.
After all, as a staffer in the House Appropriations Committee, he is surely in a better position to know than I am.
However, it is hard to square with information I put together in this chart for a story last year on Corbett's budget proposal.

I suppose the difference must be between what Corbett initially proposes, and what the General Assembly finally adopts.
But even that possibility is undermined by how things shook out locally last year after all the dust had settled:

I think I may be forgiven, after several years of such budget analysis, to have been under the impression that the trend of less school funding for poorer schools was accurate.
Nevertheless, in the battle between what I believed and what the facts are, the facts should win. Trouble is, depending on which set of numbers you use, the fact seems to be mutable.
In a June 17 email, Stoll put it this way:
I understand how the percentages you cite in your story may lead you to think one thing, but as you can see when you look at the details behind the simple percentages, it is a much different story than you portray in your story. “Poorer school districts” clearly receive the lion’s share of state funding. By only talking percentages as you do in your story, you ignore two very important facts — the number of students in the district and the amount of total revenue the districts receives from the state. When you only talk percentage you are ignoring that “poorer districts” receive more of their total revenue from the state.
That is one another thing Stoll and I agreed upon; that truly the most accurate way to measure state aid is on a "per-student" basis. Ultimately, what reaches each student is what is supposed to make the difference and provide that "level playing field" we all crave for our kids.
I complained that "per-student" information had rarely been provided to us through any state mechanism, and he replied all we had to do was ask.
Which I did.
This brings us to the next chart (yes, another one), and the second point of discussion between Stoll and myself.
If it is true that poorer school district are getting more state aid than richer districts overall, it sure seems like the increases are tipping in favor of the richer districts.
I made the point to Stoll that the point of the most recent story was in fact to compare increases; and the information we had seen over the past several years suggesting the largest increases were going to richer districts.
Once we agreed that funding on a per-student" basis is the fairest comparison, surely a comparison of local state aid on a per-student basis would dispel this belief on my part.
So I ran the numbers Stoll sent and put together this chart and I came away feeling undispelled.

Certainly, it does not show the broad disparities that the previous numbers show, although there is a $60 per-student difference from the lowest per-student increase (Phoenixville) and the largest (Daniel Boone).
But notice that Perkiomen Valley's increase per student is only $1 less per student than Pottsgrove's, another struggling district, and only $7 per student less than Pottstown's.
And when you look at the percentage of the increase per student under the House budget plan, notice that again, Upper Perkiomen and Pottstown share the lowest increases.
So color me unconvinced on that score.
Of course (for all of you have read this far without falling asleep, or gone chart-blind) all of this is moot to a large extent.
Corbett's budget proposal is not the final budget.
The House's budget proposal is not the final budget.
Not until the Senate passes a budget, it gets reconciled with the House plan and Gov. Corbett signs it do we get to argue about who got what.
Up until then, it's all rhetoric.
Even more sobering is that fact that all a final budget truly resolves in these debates is where you point the finger.
The bigger question about the success of an education funding regimen is the final product; what kind of students are we turning out?
Are we doing all we can to ensure they prepared for the world they will inherit?
I haven't found a chart yet which answers that question.
Great work, Evan.
ReplyDeleteAs usually, you ask the right questions.
Let me add one note that you can feel free to share with Mr. Stoll. The General Assembly did indeed amend the previous education funding formula out of use in 2012. (See School Code Sections 25-2502.50 and 25-2502.51) So there is currently no education funding formula in PA.
You can read more in our report on school funding formulas throughout the country: http://www.elc-pa.org/ELC_schoolfundingreport.2013.pdf